


Infographics Training
About this Lesson

Futures Lab Deputy Director
Reynolds Journalism Institute
University of Missouri
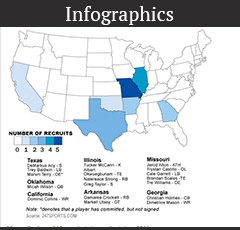
Infographics have become an essential component in print and multimedia journalism. The goal of an infographic is to present information in a visual format that enhances the reader’s ability to understand the information. The best infographics tell stories that could not be effectively communicated any other way.
What you will learn
After completing this unit, you should be able to:
- Understand what an infographic is and how it differs from a collection of explanatory text
- Understand how design tools and principles contribute to the visualization of data and other information
- Recognize some basic graphic forms and know which types of information each form is best suited to display
- Choose a basic graphic form that is appropriate for the information at hand
- Evaluate the effectiveness of an infographic
How the lesson works
First of all, this is an asynchronous lesson unit, which means no live events are scheduled for this lesson. You can complete learning activities at your own pace whenever is convenient for you. Despite the asynchronous nature, the learning tasks are organized to help you succeed.
To be successful in this unit, please complete the following tasks:
• Watch the lecture.
• Take the quiz to test your own understanding. This will help you to strengthen the concepts you just learned.
• Optional: Due to the amount of content to be covered in a single unit, we encourage you read these additional resources. Some of the quiz questions might come from the readings in Additional Resources section.
Watch the Lecture
![]()
Click on the Launch button to start
Take the Quiz
Direction: Some of the questions might from the readings in Additional Resources below
![]()
Click on the Launch button to start
Lesson Resources
Lecture Script: Downlaod it here
Printable Quiz: Infographics
ASNE Classroom Resources
Additional Resources
A FEW TOOLS FOR MAKING GRAPHICS:
Microsoft Word
Great for making simple tables. No, really. And charts, too.
Microsoft Excel
Lots of possibilities for somewhat sophisticated data plotting. Not so friendly when it comes to making the design aspects of the finished chart conform to your publication style.
Adobe Illustrator
The charting tool handles most basic chart types. If you already know how to use Illustrator, this can help because you can take more control over the aesthetics of the finished chart.
Chartbuilder
Tool built by Quartz Media for its reporters to quickly produce basic charts, now open for public use.
Infogr.am
Free online graphic creation tool that offers 30 chart types, as well as other infographic forms. Graphics can be posted to social media or embedded in another web page. Graphics also can also be exported as PNG or PDF files if you upgrade to pro version ($18/month or $180/year).
Piktochart
Lots of pre-designed templates that enable you to make fairly sophisticated choices about how your finished graphic is going to look. Includes a lot of icons and other visual elements, and the ability to upload your own visuals to include. Export options include direct Web URL, embed code, and the ability to download as PNG or JPG file. There’s a free trial, and an education discount for continued use.
Similar tools:
Easel.ly Uses a drag and drop interface to create graphic displays, with lots of pre-designed templates.
Tableau (Public)
Software (for download to your PC) that enables you to upload data sets and create visualizations from them. The graphics can then be embedded into your website. Offers highly complex visualization options. Free trial; discount price for classroom use.
Google Charts
A pretty straightforward tool for visualizing data on a web page. Requires some coding skill to make use of this, but the documentation is somewhat explanatory if you want to try to teach yourself how to do this.
Make an infographic in minutes, no design skills necessary. Canva’s infographic maker is the non-designer’s secret weapon. Trusted by millions of businesses worldwide.
Visme
An online design tool that includes ability to create custom infographics. Similar functionality to desktop software like PowerPoint or Adobe Illustrator. Graphics can be embedded into other sites (similar to YouTube videos), and changes to a graphic automatically take effect wherever the graphic was embedded. With a paid subscription graphics can be downloaded as image files (JPG, PNG, PDF), and analytics for graphics can be tracked.
Silk
Tool that turns spreadsheets of data into various types of online displays that can be embedded into other websites.
Word clouds
List of options.
FOR MAPS:
Maps4News
Online mapping tool designed specifically for news organizations that enables custom map styles, layers, vector file export, etc. In use by various large and small news organizations.
CartoDB
A fairly sophisticated tool for mapping and analyzing location data.
FOR TIMELINES:
Dipity
Free digital timeline tool that enables users to create and embed interactive timelines that include video, audio, images, text, inks social media, etc. Timelines can then be embedded in other web pages and shared on social media.
Similar tools:
TimelineJS
An open-source tool that enables beginners to build interactive timelines by entering the information into a Google spreadsheet that gets published to the Web and then copying and pasting the spreadsheet’s URL. The timelines can then be embedded. More advanced users can do programming to further customize things.
TO VIEW / LEARN ABOUT GRAPHICS:
Visualoop
A showcase of great infographics/data visualization examples, along with interviews with some of the people who created them.
FlowingData
Blog maintained by Nathan Yau, author of several books on data visualization. Includes interesting examples, discussion, etc.
Cool Infographics
A blog that posts interesting examples with discussion about the work, as well as info about trends and tools related to graphics.
Visual.ly
Actually a site that connects people who need graphics with people who can make them, but the site houses a huge gallery of finished work that you can peruse. You can also get a free graphic template (.eps file that can be edited in Adobe illustrator) if you give them a name, company and email address.
Good.is (infographics)
The site is an online gathering place for idealists, but they have an infographics feed. They used to publish a little magazine and create their own interesting graphic work, but a lot of the stuff in the feed now seems to come from elsewhere online.
Daily Infographic
Just what it says: Another example is posted every day. As with life, some days are better than others.
I Love Charts
A mixed bag of graphic examples. Some of the graphics are worthy of emulating. Some of them are posted because they have interesting information in them (but might not be that well executed). Many are just amusing for some other reason.
Society for News Design
The professional organization for news designers around the world, the site contains interesting stuff about news design in general, including some stuff about graphics.
Majofiej
International infographics conference and awards contest. Not exactly the place for beginners to start, but a great place to see what is possible at the high end of the world of graphics.
The Functional Art
This website for a book includes a blog roll with new posts added continually that explore various aspects of infographic thinking and creation.
ICON RESOURCE:
The Noun Project
A communal effort to build a visual collection of icons and symbols to break down language barriers, this site offers a searchable database of individual images representing all sorts of objects. Some of the icons have no rights reserved (meaning you can download and use them); others you must credit and/or buy.
SOME GRAPHICS DEPARTMENT TWITTER ACCOUNTS:
@nytgraphics
@WSJGraphics
@elmundograficos
@GuardianVisuals
@GlobeVisuals
@ChiTribGraphics
@LATimesGraphics
@FortuneGraphics
@BBCNewsGraphics
@ReutersGraphics
@VoxMaps
@BI_Graphics
@UpshotNYT
@bizweekgraphics
@HuffPostGraphic
@538viz
@BBGVisualData
@ECONdailycharts
OTHER RESOURCES:
The 6 Principles of Design
A visual guide to the central vocabulary/themes associated with visual design. “How one applies these principles determines how successful a design may be.”
The Graphic Continuum
“Nearly 90 graphic types grouped into 6 categories on a laminated 8.5″x11″ sheet…. Use it to develop ideas, consider different options, or simply as a piece of art.”
Graphics and design books
An incomplete but still helpful list of books related to infographics and other design topics.